Overview
Interactive dashboard for Dutch electricity market data and BirdCurve NL price forecasts.

A six-page web app for exploring the Dutch power market and the BirdCurve NL price-forecasting model that drives BESS revenue analysis out to 2050. Inspect commodity prices, the supply/demand stack, day-ahead and intra-day forecasts, ML model diagnostics, ancillary-services capacity, and scenario assumptions — all backed by a single read-only DuckDB file.
Why it exists
Energy analysts need to see the data, the forecast, and the model's behavior in one place — not a Jupyter notebook, not a static PDF. This dashboard is the interactive companion to the BirdCurve NL pipeline: same data, same model, but explorable from any browser.
Highlights
- Native DuckDB query engine — wide-format columnar reads in milliseconds, no ORM, no Python pivot loops
- Async FastAPI handlers with threadpool offload for blocking file I/O, and HTTP
Cache-Controlfor immutable historical ranges - React 19 + TanStack Query + Vite 7 frontend; ECharts for analytics, TradingView lightweight-charts for time series
- Server-side LTTB downsampling caps every chart payload to a few thousand points without losing extremes
- 31 integration tests against a live DuckDB; bring-your-own-data design (no proprietary market data committed)
Pages
Commodities — TTF gas & EUA CO₂
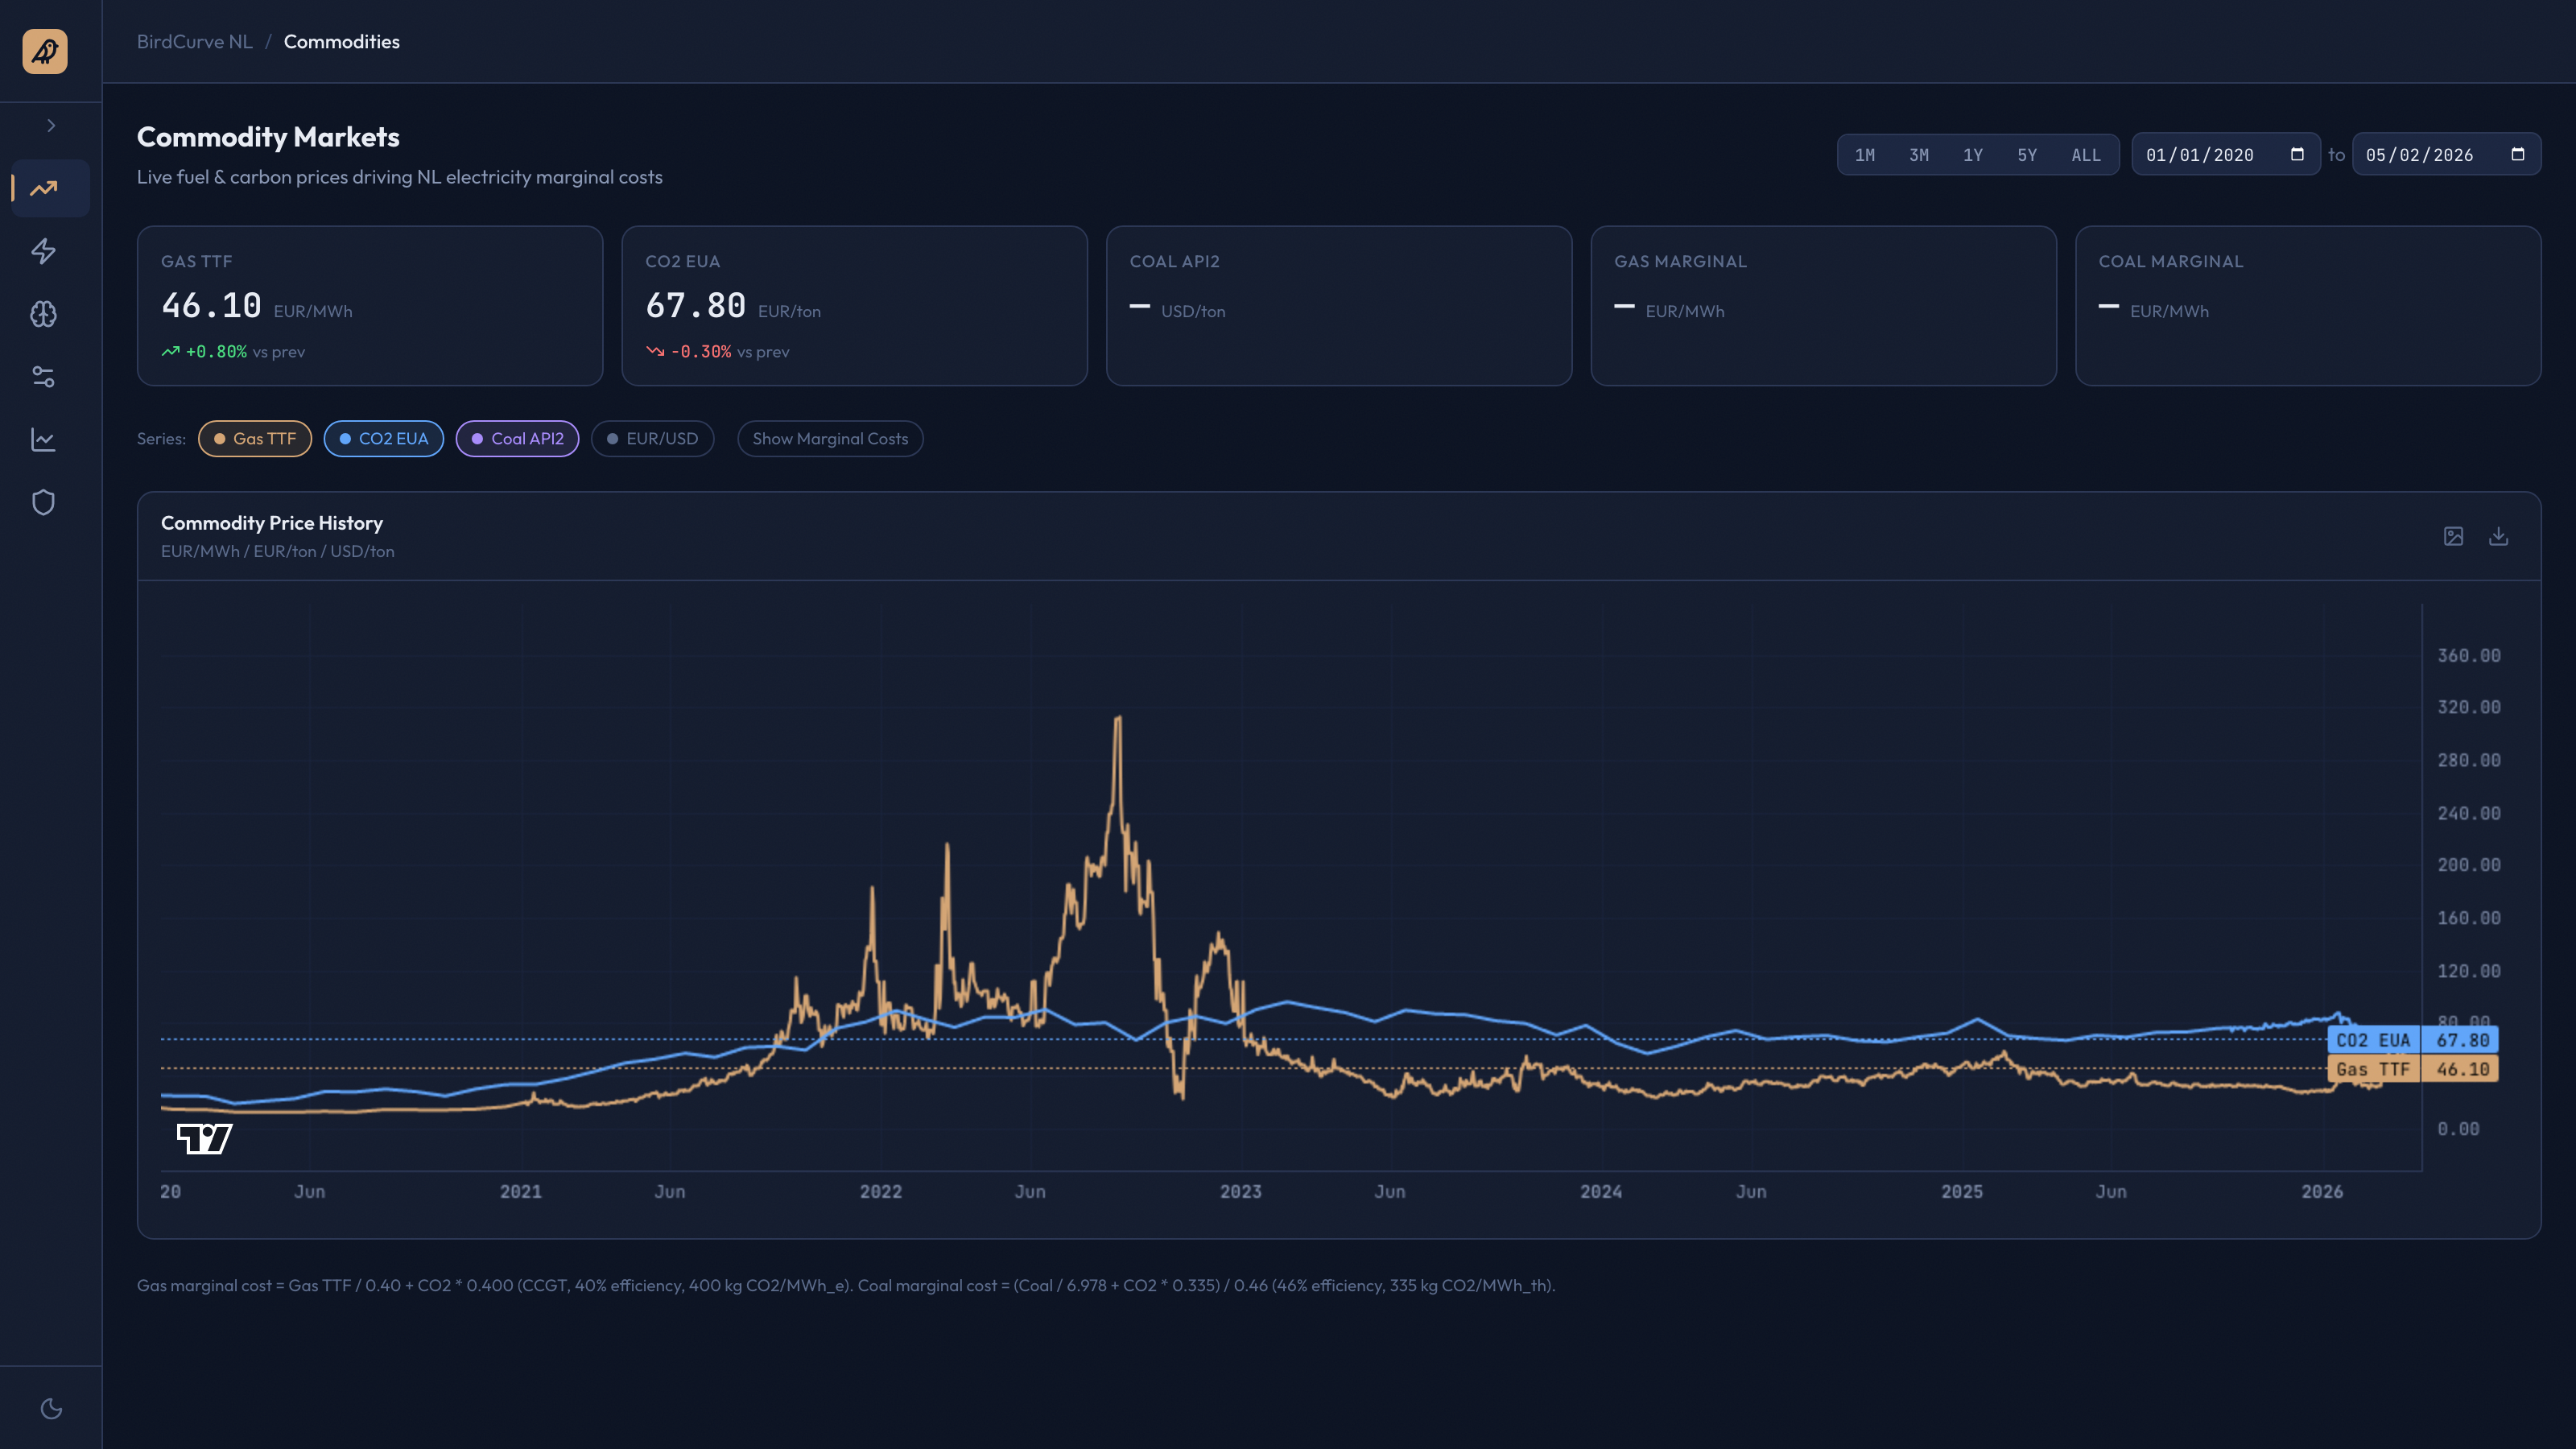
Live Gas TTF, CO₂ EUA, Coal API2 and EUR/USD with KPI cards and 30-day deltas — toggle the Marginal Costs overlay to see how fuel + carbon translate into the cost of the next MWh on the grid (CCGT @ 40% efficiency, coal @ 46%).
Electricity — supply, demand & cross-border flows
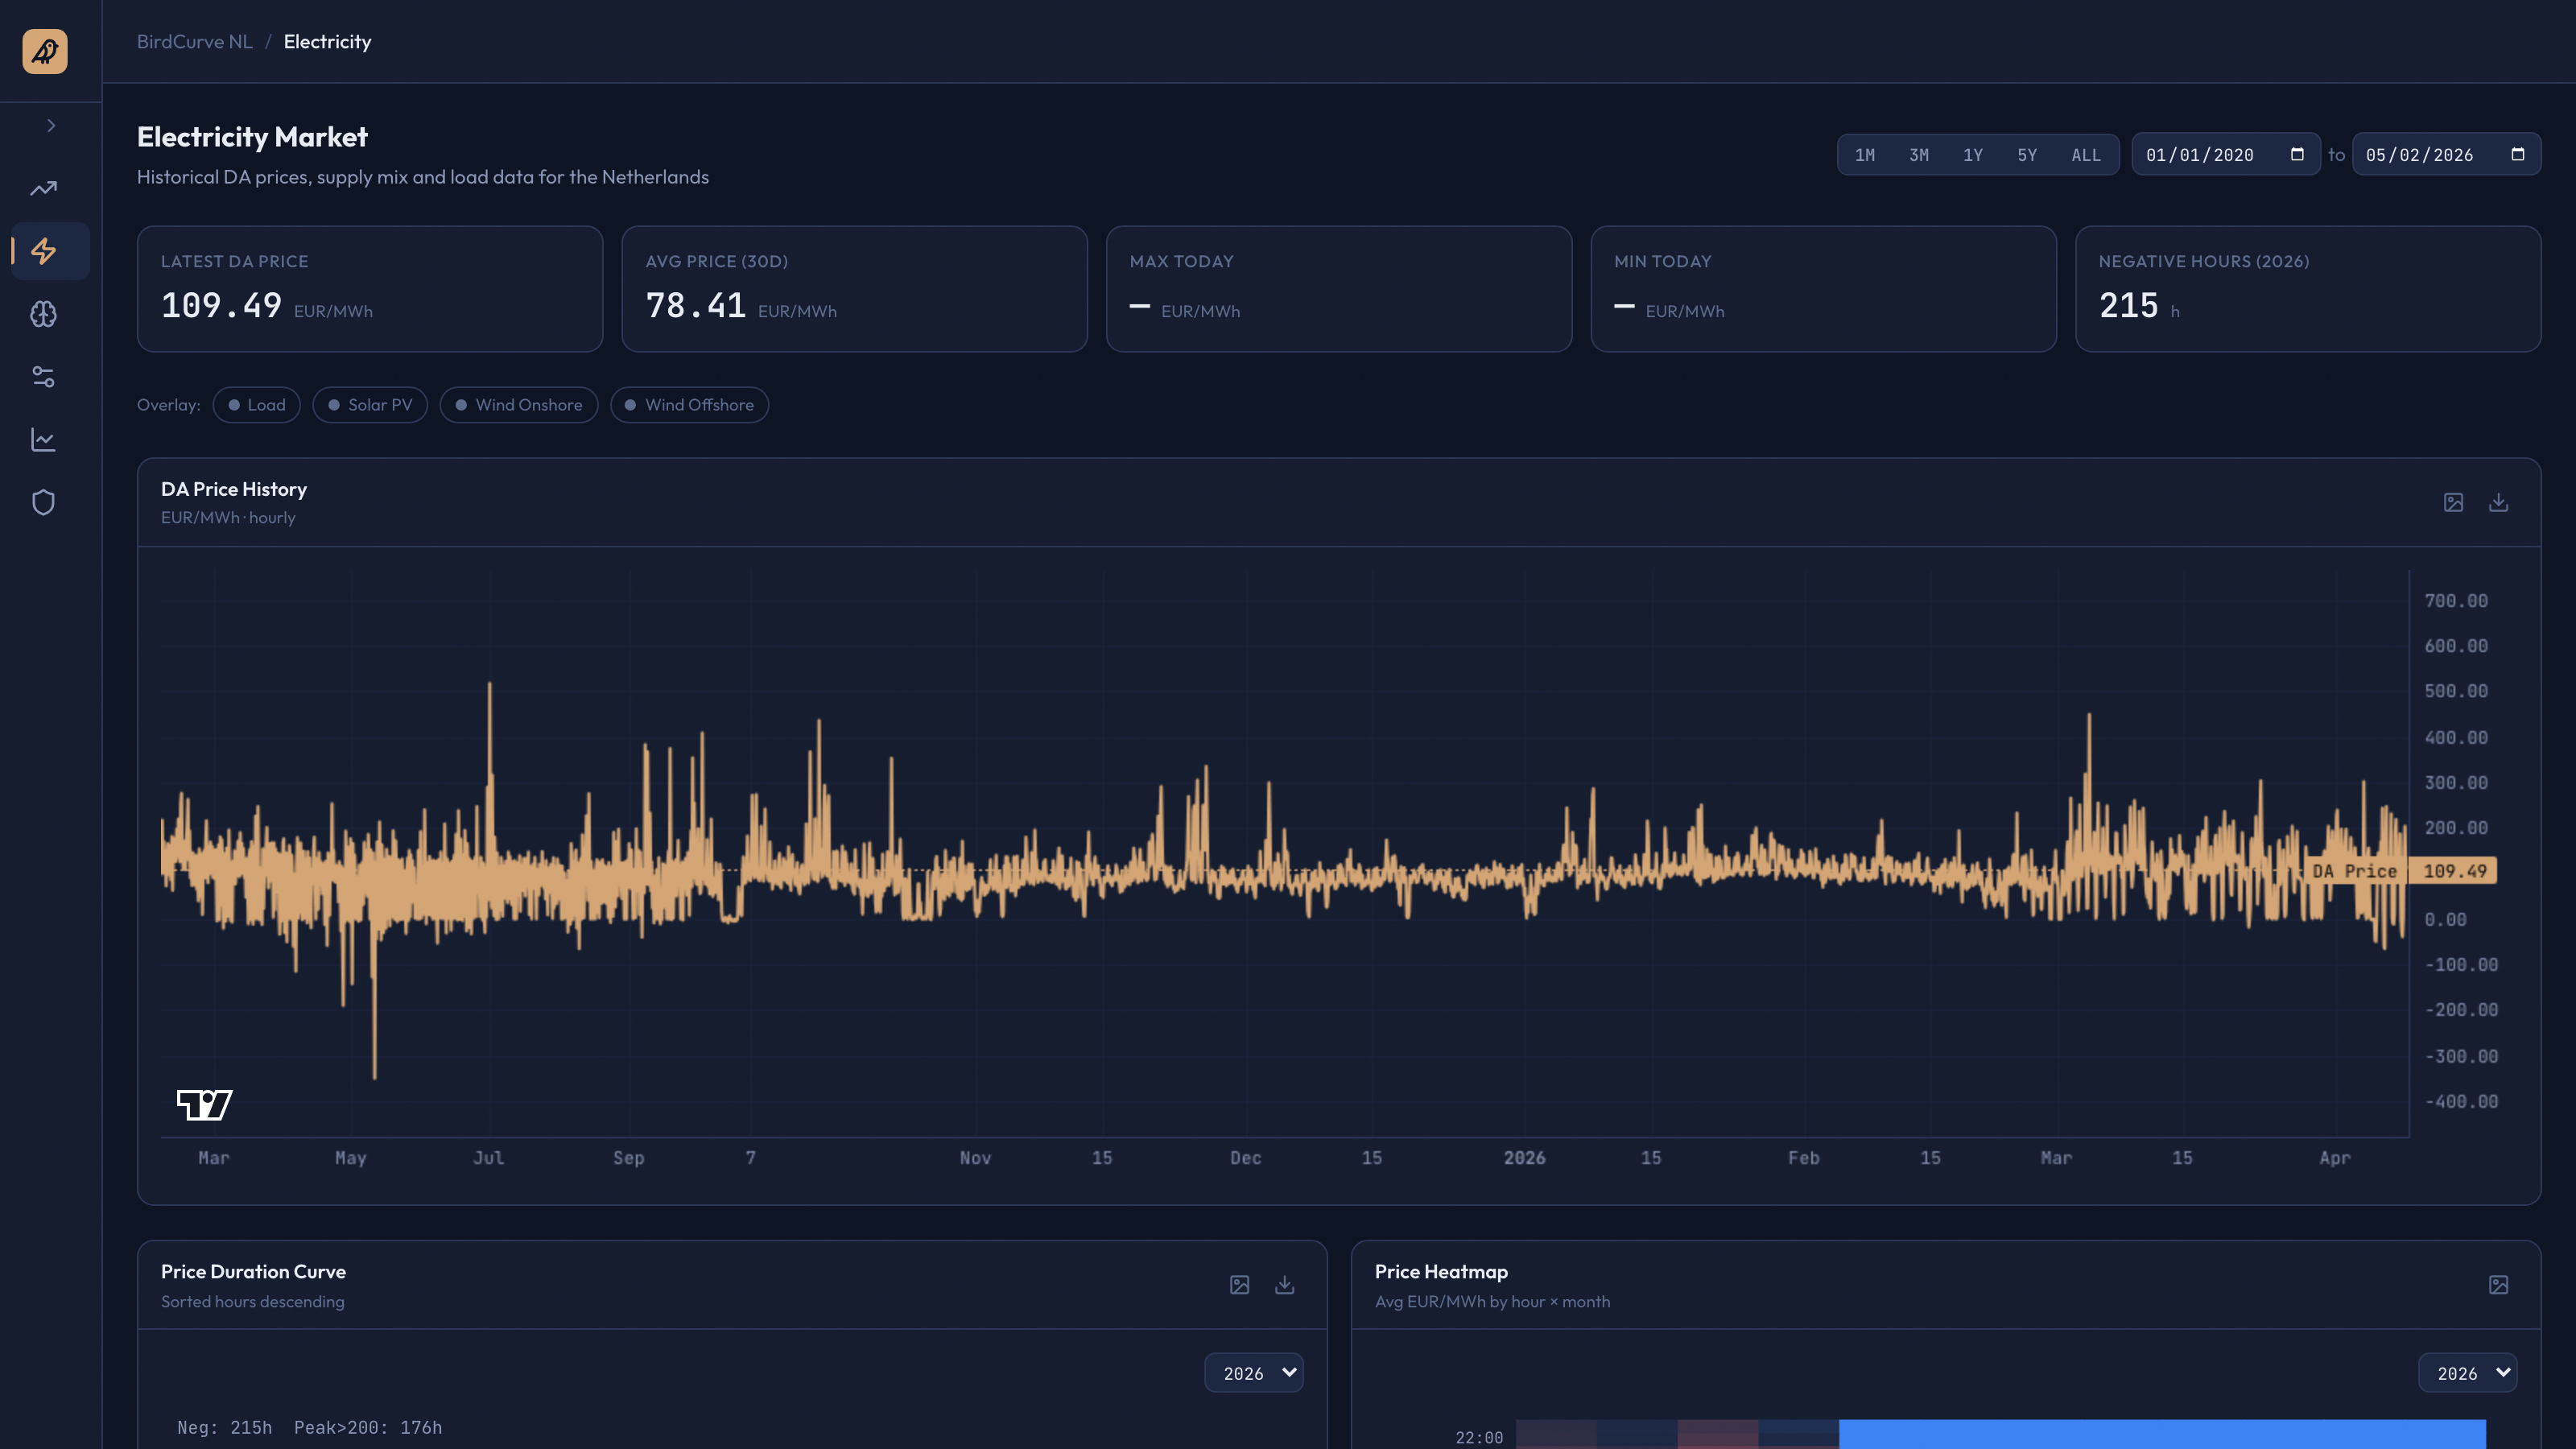
Day-ahead price history with optional load / PV / wind on/offshore overlays, plus a sorted price-duration curve (with negative-hours count) and an hour-×-month heatmap that shows where on the calendar the cashflow actually lives.
Forecast — day-ahead & intra-day price predictions
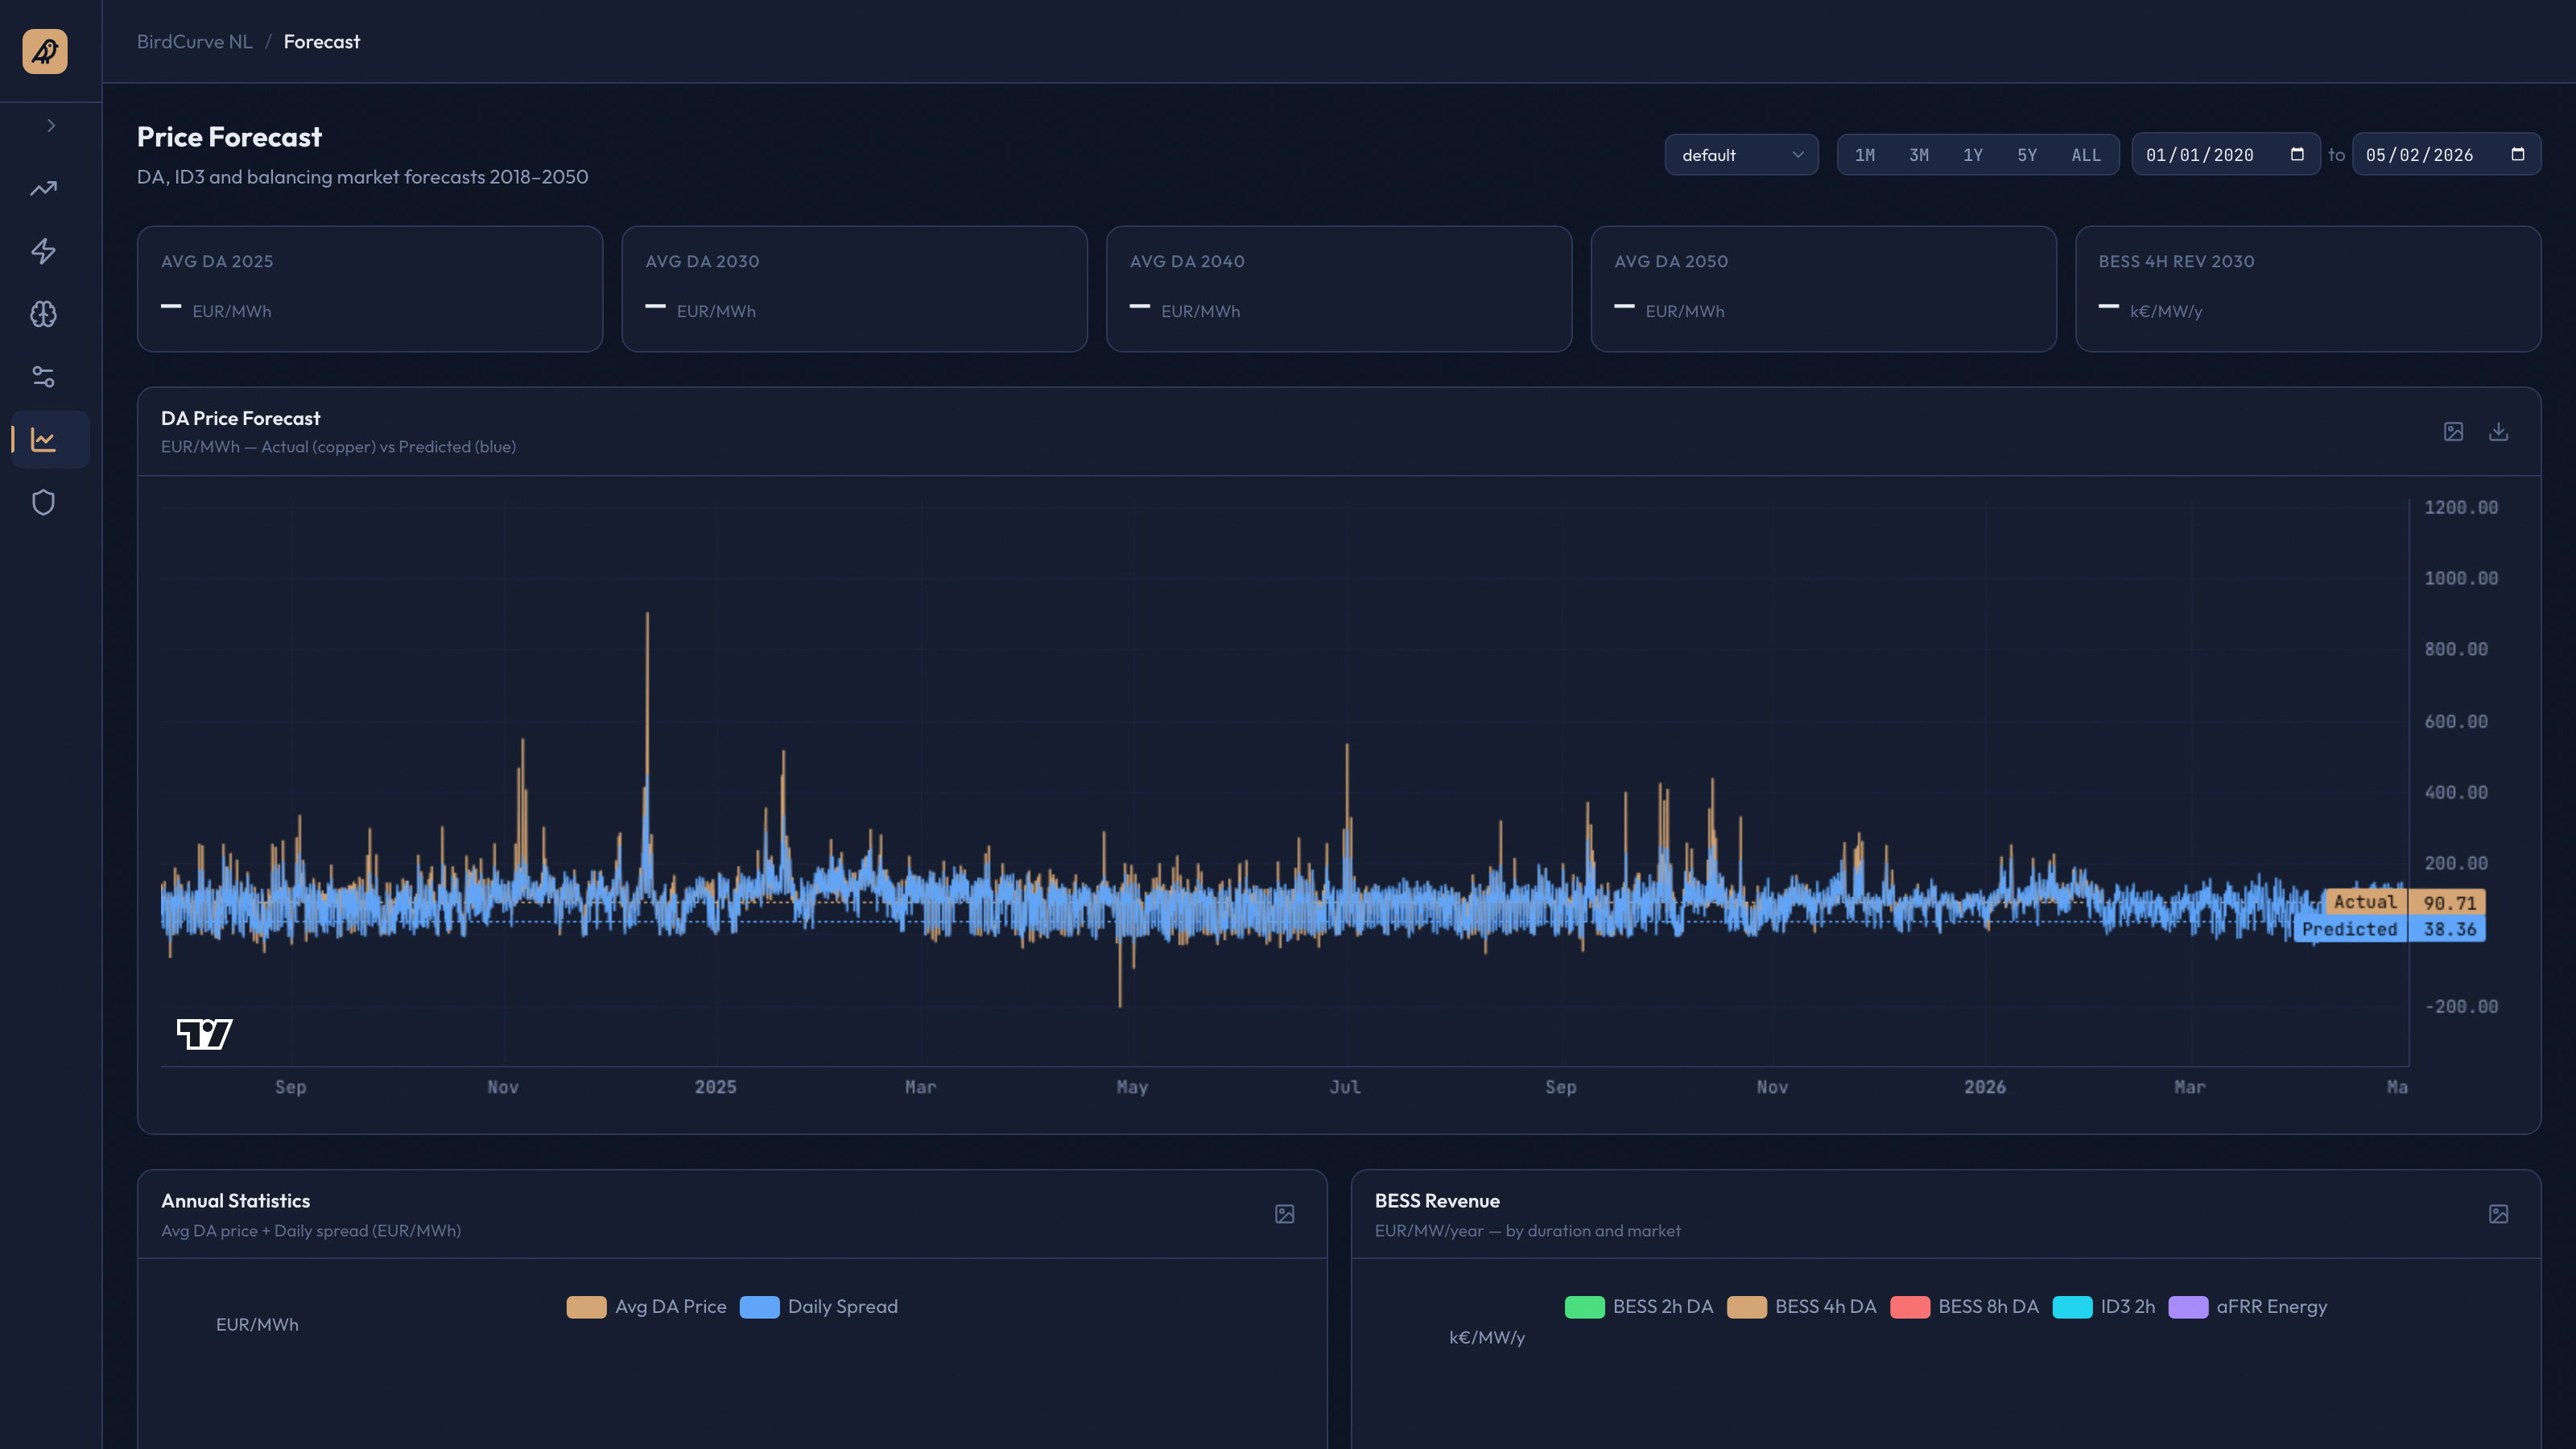
BirdCurve NL forecast vs realised DA prices for the selected scenario, with annual avg/spread bars 2018–2050 and BESS revenue per duration class (2h / 4h / 8h DA, ID3 2h, aFRR Energy) in k€/MW/year.
ML — model diagnostics
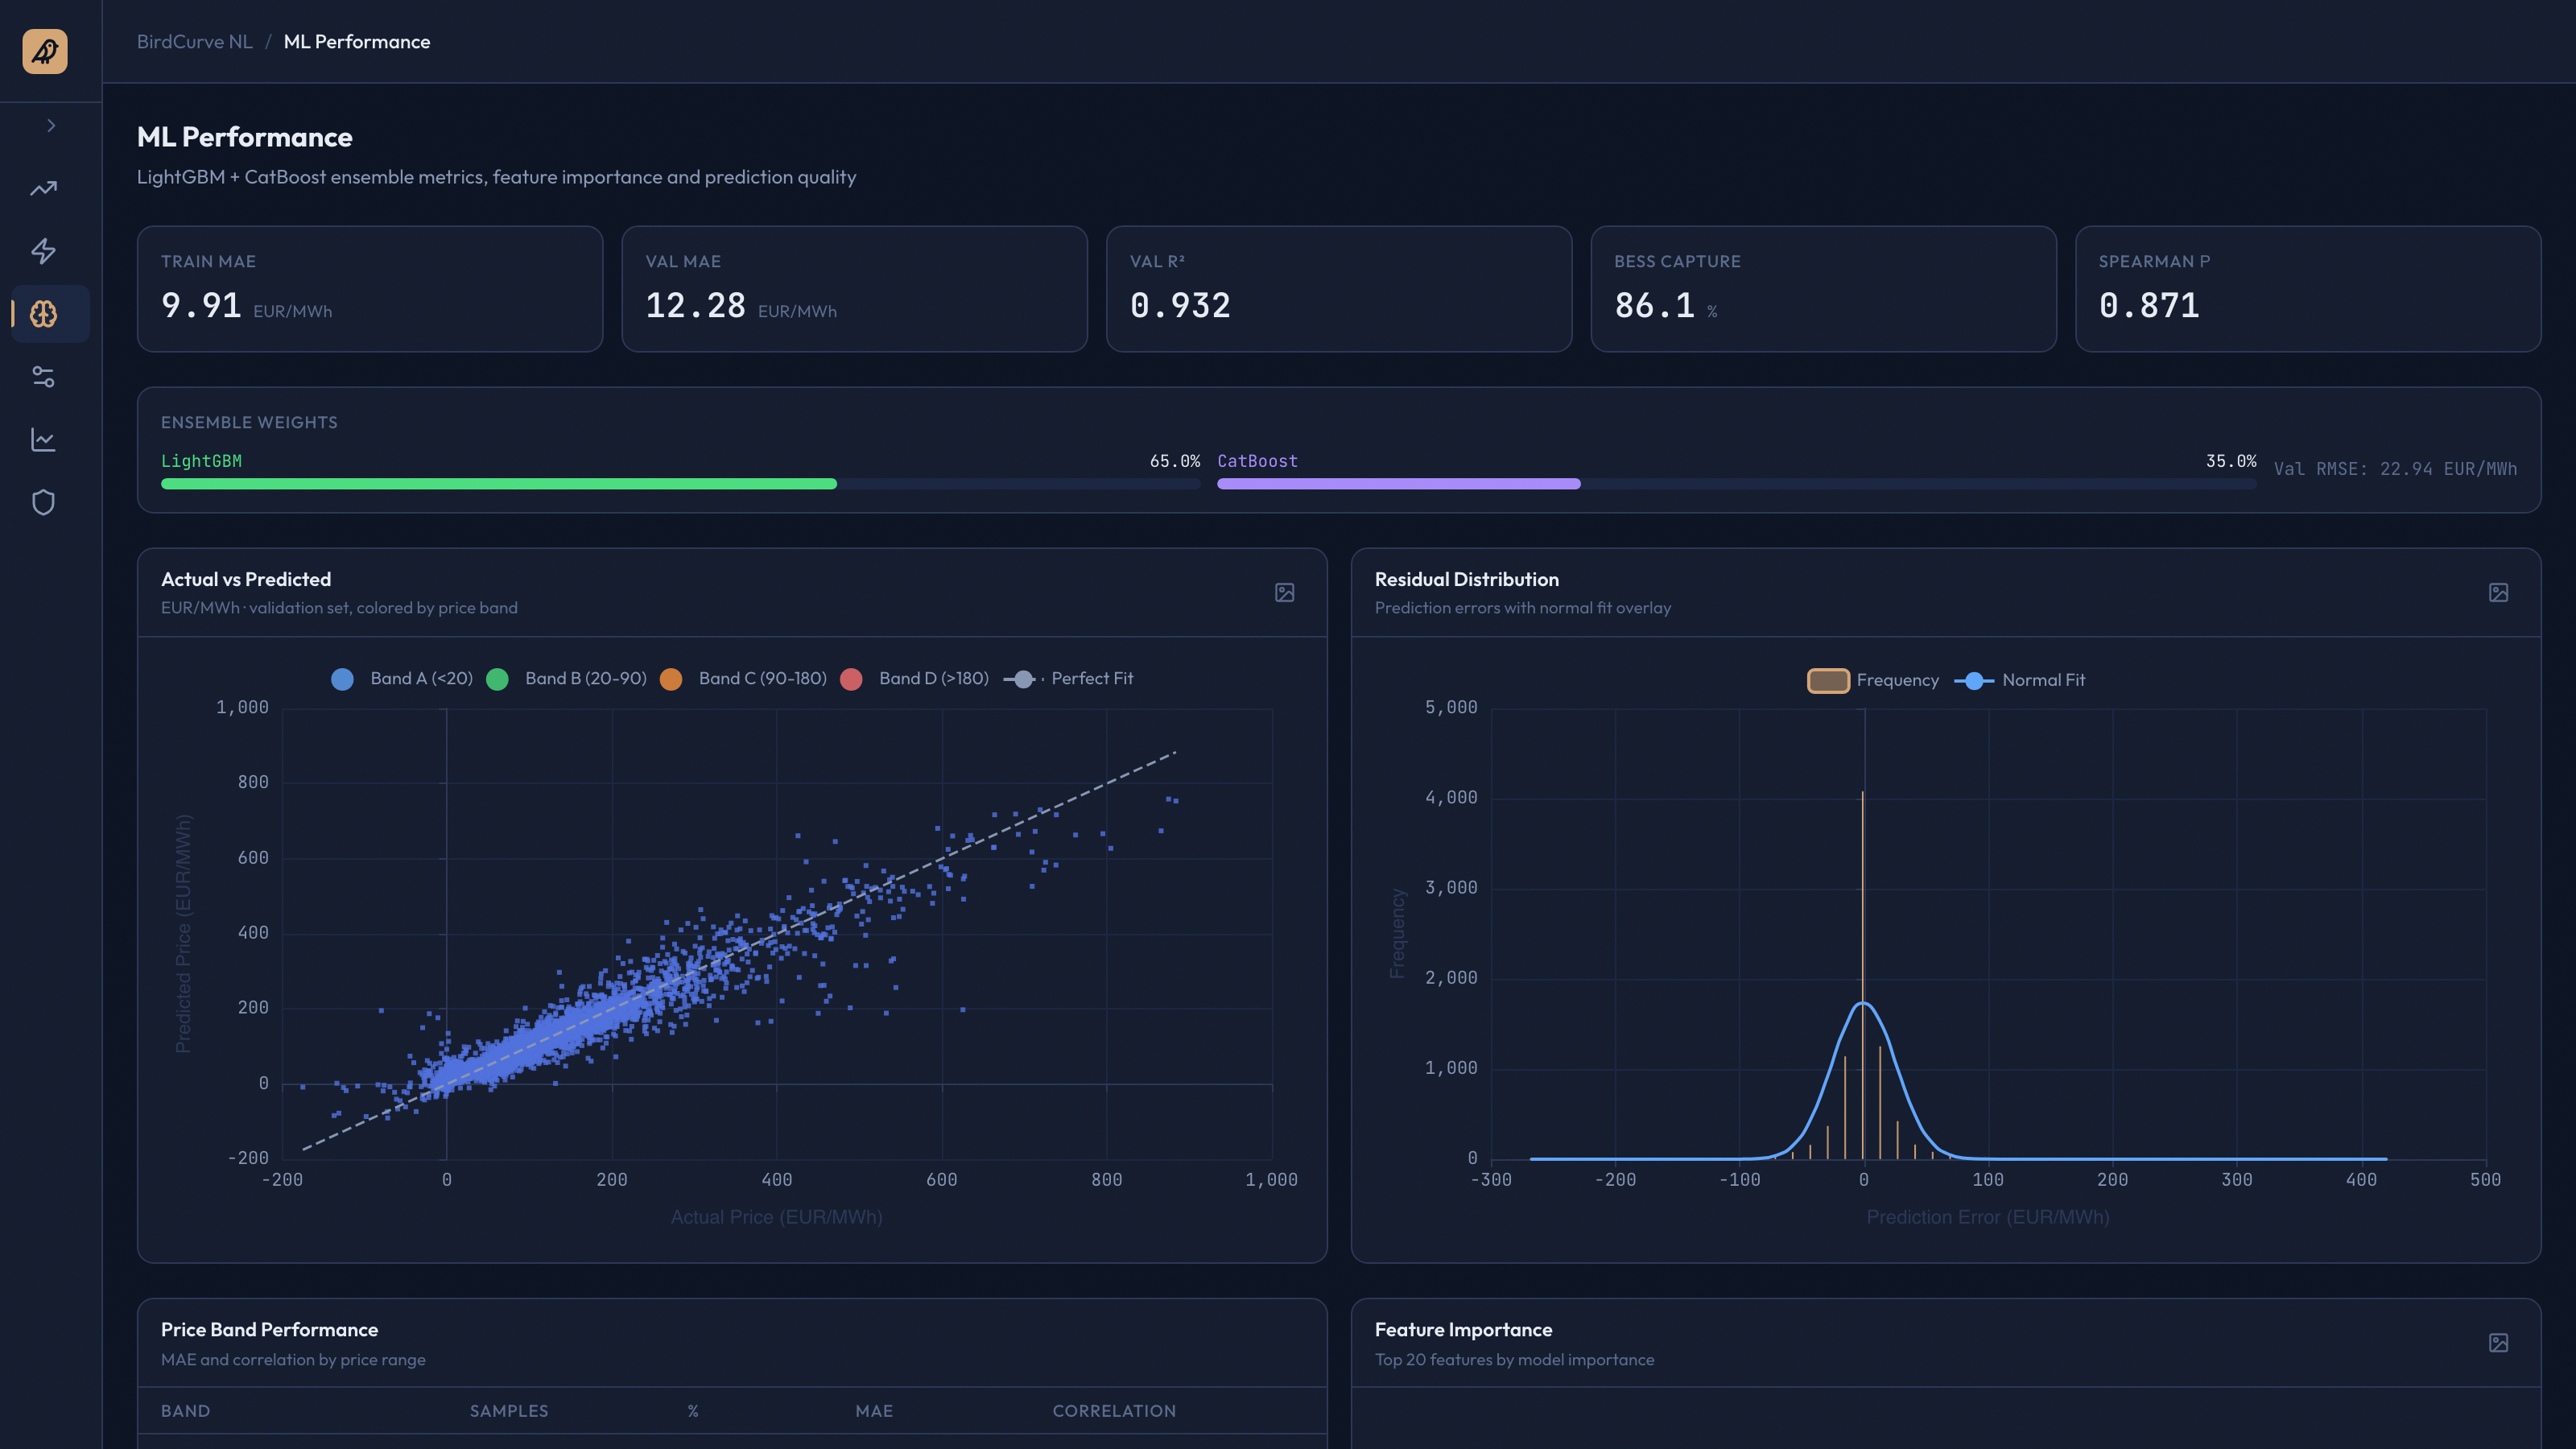
Feature importance from the LightGBM regressor, hold-out prediction-vs-realised scatter, and per-year forecast distribution KDEs that surface skew and tail behaviour the headline RMSE hides.
Ancillary — aFRR & mFRR capacity / energy

TenneT ancillary-services capacity-auction prices and activated-energy volumes, with revenue contribution split by reservation vs. activation.
Scenarios — long-run capacity & revenue
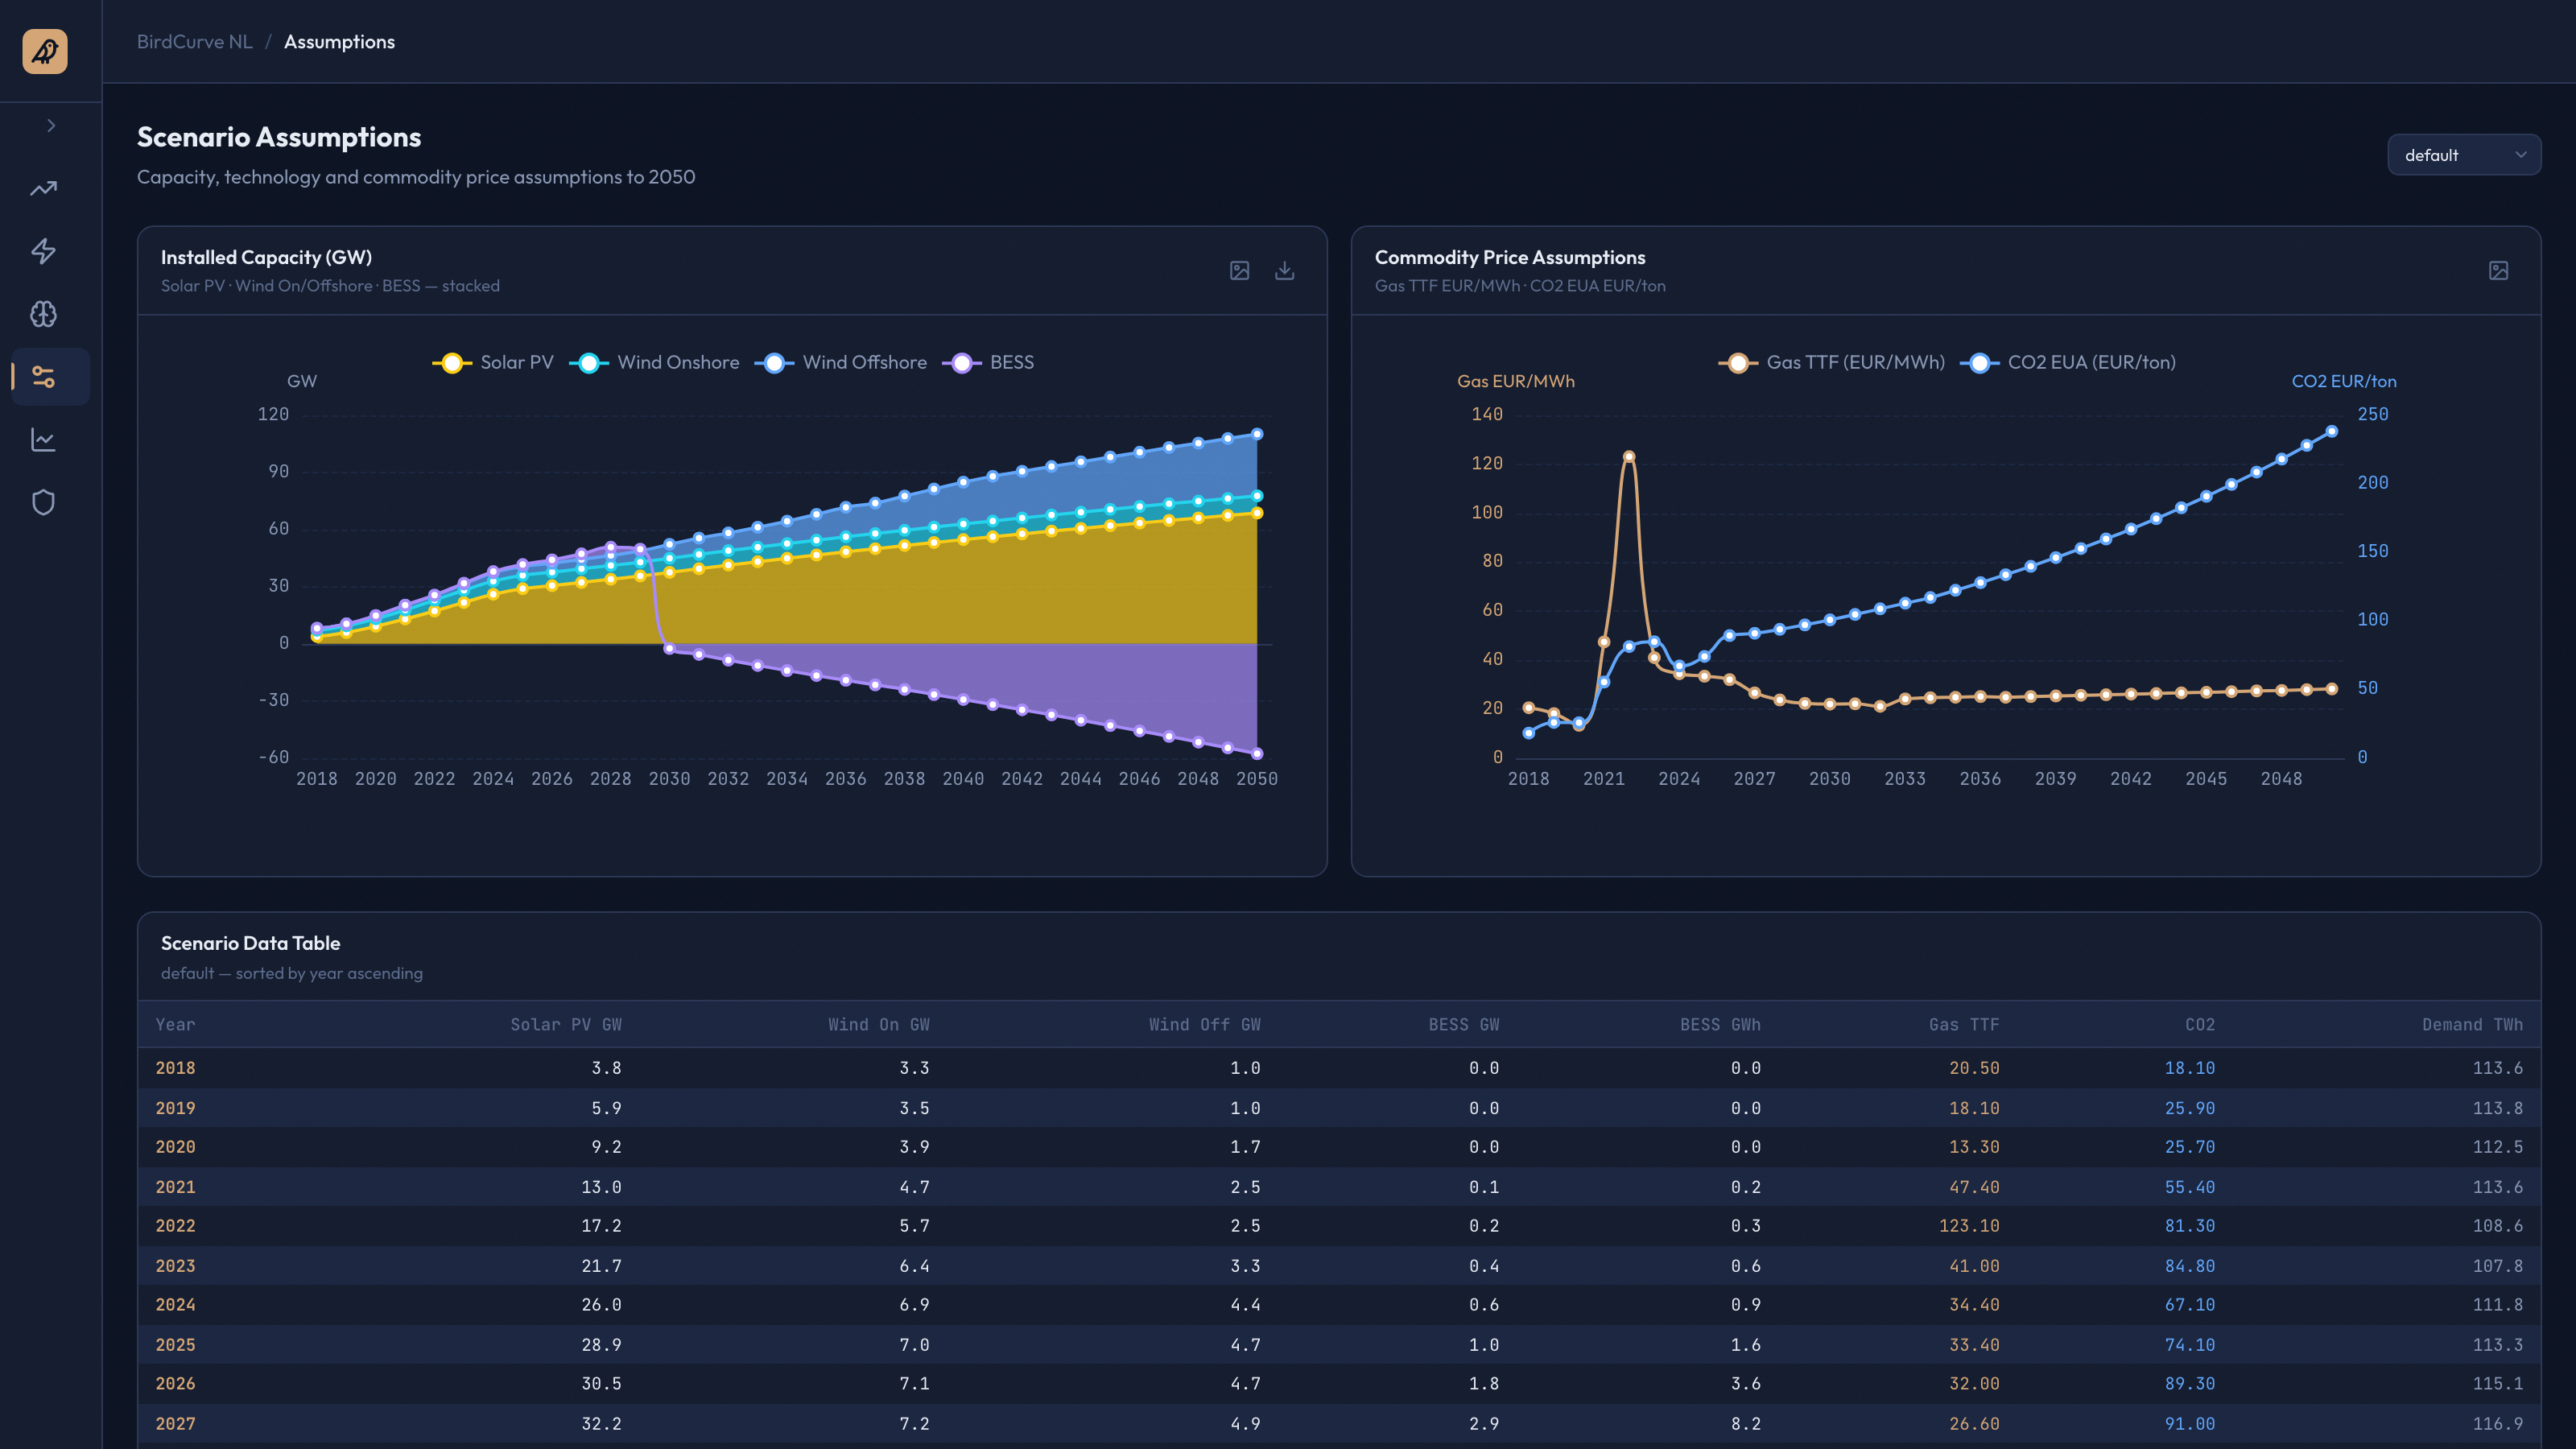
Capacity-expansion scenarios out to 2050 — installed-capacity stack by technology and projected revenue per duration class. Useful for sanity-checking BESS investment cases against the model's own future.